
On this page
Before assuming current is distributed through the full thickness of a printed silver conductor, compare that thickness with the skin-depth scale at the relevant frequency. The answer depends on a justified conductivity model for the processed film, not simply on the word silver. This review addresses penetration through the conductor thickness; it does not replace the separate definition and measurement of the complete circuit's complex impedance.
System boundary
A processed silver conductor, its return and attachment interfaces over a stated spectrum; excludes universal RF material or current capability.
Integration interfaces
| Interface | Required input | Thick film role | Validation owner |
|---|---|---|---|
| Processed film to conductivity model | Sheet resistance, thickness, temperature and uniformity evidence. | Provide the actual conductor construction rather than assumed bulk metal. | Materials and circuit owners. |
| Outgoing path to return geometry | Loop spacing, length, terminals and frequency spectrum. | Implement the defined conductor/return layout. | Signal-integrity designer. |
| Fixture to impedance reference plane | Calibration, de-embedding and complex measurements. | Provide accessible defined measurement boundaries. | RF or impedance metrology owner. |
Integration risks
| Risk | Control or verification | Validation owner |
|---|---|---|
| Bulk-silver conductivity is assigned to a fired composite without evidence. | Use processed-material data and validate the screening model. | Materials owner. |
| Reactive voltage is reported as conductor dissipation. | Retain complex impedance and the real-power boundary. | Circuit designer. |
| Fixture inductance is attributed to the ceramic trace. | Document reference plane and fixture contributions. | Measurement owner. |
System integration decisions
- Separate the DC resistance requirement from the complex impedance required over the signal spectrum.
- Use skin depth as a model-selection scale, not as a direct prediction of an irregular fired film's AC resistance.
- Include the return and terminal geometry before assigning every frequency-dependent voltage to conductor loss.
Specify the spectrum and the complete current loop
State whether the interconnect carries a sinusoidal signal, a pulse train or another waveform. A switching repetition rate alone does not describe fast edge content. Identify the source, outgoing conductor, load, return route and their physical spacing. At higher frequencies, that geometry can matter as much as the measured end-to-end DC resistance.
Decide the required output: allowable amplitude loss, phase shift, heating, ringing or impedance match. These are different constraints. A voltage measured across a series path can include reactive and dissipative components. Do not call its magnitude a resistance until the phase and circuit boundary support that interpretation. Keep any distributed transmission behavior separate from a simple lumped model when the physical length is no longer electrically short.
Obtain the conductivity evidence for the actual fired construction
A fired silver conductor contains the microstructure produced by its paste and processing route. Do not assign it the conductivity of bulk silver solely because the surface appears metallic. Use applicable measured sheet resistance and finished thickness or an otherwise justified material model. In a uniform-film DC approximation, conductivity is the reciprocal of sheet resistance times thickness, but nonuniform thickness and current constrictions limit that inference.
Record temperature, geometry and any layers or finishes included in the measurement. A DC result may provide a starting effective conductivity for a screening model, not prove homogeneous high-frequency behavior. If the film includes substantial porosity, roughness or nonuniform current paths, compare the model with frequency-dependent measurements on representative structures before relying on it in a tight RF requirement.
Compare thickness with a clearly bounded skin-depth estimate
In a homogeneous good conductor under sinusoidal excitation, skin depth is a characteristic distance over which field amplitude decays into the material. It is not a hard boundary beyond which current is zero. The familiar estimate decreases as the square root of frequency, permeability or conductivity increases. It is a scale for judging penetration under the model, not a complete solution for every printed cross-section.
For the nonmagnetic screening calculation below, use permeability approximately equal to that of free space. The formula assumes conduction current dominates displacement current and a homogeneous material description is meaningful. Thin finite films, nearby returns and edge geometry alter the actual distribution. A small thickness-to-skin-depth ratio can make strong through-thickness crowding less likely in the simple model, while leaving lateral proximity and inductive effects unresolved.
delta = sqrt[1/(pi f mu sigma)]
- delta: skin-depth scale in meters; f: sinusoidal frequency in hertz.
- mu: magnetic permeability in henries per meter; for this nonmagnetic example mu ≈ 4π × 10^-7 H/m.
- sigma: assumed homogeneous conductivity in siemens per meter, not an automatically assigned bulk-silver value.
Homogeneous good-conductor sinusoidal model. The expression alone does not determine AC resistance of an irregular finite fired film or its return structure.
Use assumed conductivity ranges to expose model sensitivity
At an illustrative frequency of 10 MHz, assume conductivity of 1.0 × 10^7 siemens per meter. The skin-depth estimate is approximately 50.33 micrometers. With an assumed film thickness of 10 micrometers, the thickness-to-depth ratio is about 0.199. If conductivity were instead 5.0 × 10^7 siemens per meter, the estimated depth would be about 22.51 micrometers and the ratio about 0.444.
These are hypothetical homogeneous materials, not claimed values for a ChipSimple paste or product. The comparison shows why importing a bulk conductivity changes the penetration estimate. It does not rank the two films' finished-circuit performance. At four times the frequency, each model's skin depth halves; geometry and frequency must therefore remain attached to any statement about whether a DC approximation is adequate.
| Assumed conductivity | Skin-depth scale | Thickness/depth | What remains unresolved |
|---|---|---|---|
| 1.0 × 10^7 S/m | 50.33 µm | 0.199 | Actual film uniformity and return geometry |
| 5.0 × 10^7 S/m | 22.51 µm | 0.444 | Validity of using this conductivity |
| Same material at 40 MHz | Half its 10 MHz depth | Twice its 10 MHz ratio | Complete finite-geometry current distribution |
Check inductive voltage even when thickness is below skin depth
A loop can have significant inductance without strong through-thickness skin concentration. For an electrically short lumped example, the inductive reactance is 2πfL. With an assumed loop inductance of 20 nanohenries at 10 MHz, it is about 1.257 ohms. That exceeds an assumed DC resistance of 0.20 ohm, even though neither value alone describes the complete conductor system.
In the simplified series model Z=R+j2πfL, the real part represents resistance and the imaginary part represents inductive reactance. The magnitude of Z is not the dissipative resistance. For an RMS sinusoidal current, real power in the modeled series resistance is I squared times R, not I squared times the magnitude of Z. Frequency-dependent resistance, dielectric loss and other paths must be added when relevant rather than hidden inside that distinction.
Choose the next model from the unresolved physical effect
If the main concern is DC drop, use the existing segmented resistance model and its verified boundaries. If phase or high-frequency voltage matters, include the complex impedance of the actual loop and transitions. If the conductor thickness becomes comparable to the skin scale, or current is strongly concentrated by nearby conductors, a field or otherwise validated frequency-dependent model may be needed.
Do not improve the drawing by automatically adding thickness everywhere. A wider path, closer controlled return or shorter terminal may address a different dominant contribution, while added material can change processing and attachment. Compare alternatives using the relevant output quantity. A change that lowers DC resistance can leave the dominant loop reactance nearly unchanged, and a return-path change can affect coupling to neighboring circuits.
Measure impedance at the same boundary used by the model
Select a calibrated measurement method suitable for the frequency range and expected impedance. Preserve fixture, lead and connector effects through a justified calibration or de-embedding method. An instrument calibration at a cable connector does not automatically remove the inductance of a later ceramic fixture. State the reference plane and any residual fixture contribution.
Compare a representative processed structure across frequency and temperature under a controlled signal level. Retain magnitude and phase or real and imaginary components, not only an equivalent resistance number chosen by an instrument model. Repeat with a justified fixture comparison if terminal or return contributions may dominate. Confirm that the test amplitude does not create an unintended thermal or nonlinear change in the specimen.
Specify the conductor as part of an AC interconnect
Provide the finished conductor and return geometry, material evidence, frequency spectrum and the allowed electrical effects. Separate DC resistance, real loss, reactive voltage and any matching requirement. Include the attachment, external wire and connector boundaries instead of treating the printed area as the complete path. A measured coupon supports only the geometry and conditions it actually represents.
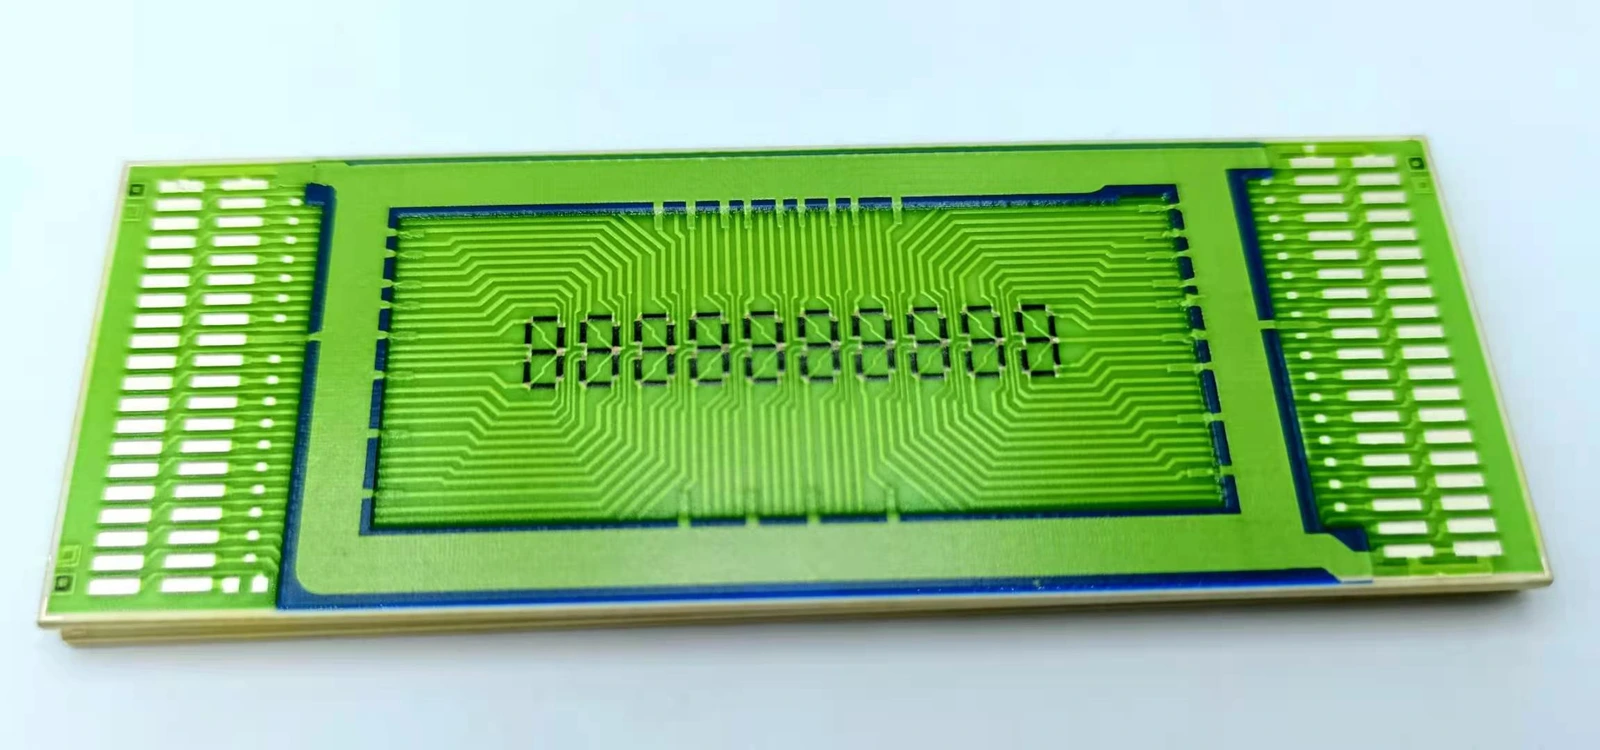
For a custom ceramic thick film circuit, ChipSimple can review the drawing and required interconnection with those inputs. The engineering result should identify which model is adequate, which assumptions require measurement and which interface dominates the budget. It must not turn a calculated skin depth into a universal RF capability, current rating or claim that every silver-colored film performs like bulk metal.
Send the frequency-dependent interconnect requirement
Include the return path and electrical spectrum with the ceramic artwork.
- Finished dimensions, material and sheet-resistance/thickness evidence.
- Signal spectrum, current level, temperature and permitted loss/phase effects.
- Return, terminal, joint, wire and connector geometry.
- Complex impedance records, calibration and fixture reference plane.
The drawing-upload form loads as you reach this section.