
On this page
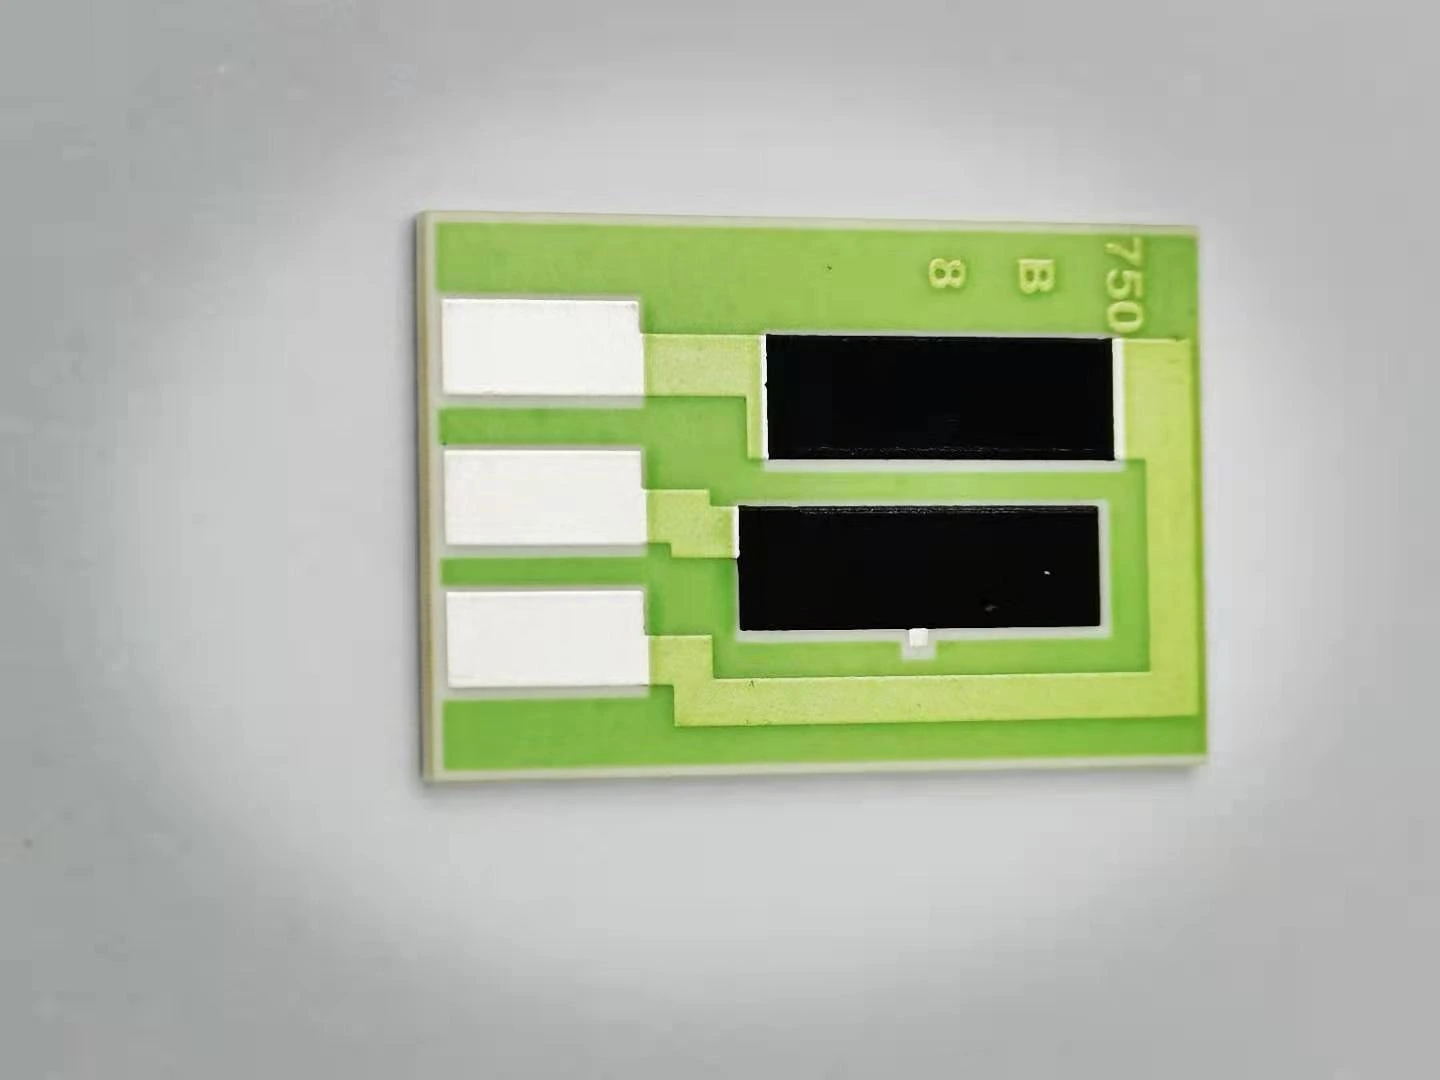
A calibrated image scale does not uniquely define the edge of a printed thick-film resistor. Near a feathered boundary, the image changes gradually from ceramic background to dark resistive film. Two segmentation thresholds can report different widths from exactly the same pixels. The inspection method must define which transition represents the drawing boundary and show how sensitive that result is to the selected threshold.
Measurement purpose
Separate image segmentation sensitivity from actual printed resistor width variation.
Specimens and conditions
- Boundary authority
- Drawing-defined material footprint and measurement positions.
- Image state
- Native nonclipped image with relevant layer construction known.
Equipment and records required
- Capture: Documented scale, contrast, focus and illumination.
- Analysis: Line profiles, unchanged-image threshold sweep and boundary overlays.
Method sequence
- Define
Identify the physical edge and fixed measurement coordinates.
Record: Boundary convention.
- Challenge
Sweep thresholds on one image without altering capture variables.
Record: Width sensitivity profile.
- Validate
Compare selected edge behavior with relevant independent observations.
Record: Permitted algorithm and material conditions.
Decision and uncertainty
Accept a dimensional result only under a defined and validated edge-selection convention.
Threshold, focus, contrast and calibration effects must not be conflated or double-counted.
Dimensional-method and drawing owners.
Traceable outputs
| Record | Required contents |
|---|---|
| Image analysis | Original files, profiles, thresholds and local width results. |
| Method definition | Physical edge meaning, algorithm version and limitations. |
Method review decisions
- Keep the original image fixed while testing the effect of threshold selection.
- Separate geometric calibration from the definition of a material edge.
- Do not tune a threshold until the measured width happens to meet the drawing.
Define the physical width before segmenting its image
Identify whether the drawing controls the continuous resistive body, the outermost deposited material, a printed artwork boundary or a specified measurement convention. These can differ at a tapered or feathered edge. A faint peripheral deposit may be visible without having the same electrical role as the central film. The darkest region is not automatically the full material footprint.
Mark the measurement direction and locations on the actual resistor. Width near a conductor termination or trim kerf may differ intentionally from the central body. Keep the chosen cross-sections tied to drawing coordinates, not to whichever image row appears most uniform. If the acceptance definition is ambiguous, resolve that ambiguity before comparing lots or treating a software result as dimensional truth.
Hold the image formation conditions steady
Retain native image data, scale, illumination, focus and processing settings. First establish that the required boundary is visible without saturation or severe blur. Pixel spacing describes sampling, while optical contrast and resolution determine whether neighboring structures can be distinguished. Calibrating a ruler in the image does not establish the physical meaning of a gray-level transition.
For a threshold study, process the same unchanged image repeatedly. Do not change focus, exposure or specimen position at the same time as the threshold. Otherwise the observed width change contains several causes. After the algorithm behavior is understood, use separate captures to evaluate permitted lighting and surface variation. Keep those experiments distinct in the record.
Inspect a line profile before accepting a binary mask
Extract intensity profiles across representative straight sections and include background on both sides. State the channel or transformed score used by the algorithm and which direction indicates resistor material. A color image converted to grayscale or normalized locally can produce a different transition from a raw channel. Record that transformation as part of the measurement method.
Look for a gradual ramp, multiple transitions, local particles and nearby glass boundaries. A single threshold can select the wrong material when a green overglaze edge crosses the same region. Inspect the selected boundary overlaid on the authentic image, then relate it to the layer construction. A clean binary outline is only an algorithm output; visual neatness cannot validate its physical interpretation.
Calculate threshold sensitivity on one unchanged profile
Consider an illustrative darkness score that increases with darker resistor material. At the left edge it rises linearly from 20 at image coordinate 40 pixels to 80 at 46 pixels. At the right edge it falls from 80 at 154 pixels to 20 at 160 pixels. The assumed scale is 2 micrometers per pixel, and the profiles between the stated endpoints are linear solely for this example.
A threshold of 30 selects the left boundary at 41 pixels and the right boundary at 159 pixels. Their separation is 118 pixels, or 236 micrometers. A threshold of 70 selects boundaries at 45 and 155 pixels, giving 110 pixels or 220 micrometers. The 16 micrometer difference arose without any change to the resistor, the image or the pixel calibration. It measures algorithm sensitivity, not actual shrinkage or instrument accuracy.
| Darkness threshold | Left and right coordinates | Apparent width |
|---|---|---|
| 30 | 41 and 159 pixels | 236 micrometers |
| 50 | 43 and 157 pixels | 228 micrometers |
| 70 | 45 and 155 pixels | 220 micrometers |
| Threshold sweep from 30 to 70 | No specimen or image change | 16 micrometers of apparent-width sensitivity |
Choose the rule from the acceptance feature, not the desired result
A permitted threshold range or edge-fitting rule needs a reason tied to the physical feature. Compare suitable independently characterized specimens, including meaningful edge variation, with an observation that addresses the required material boundary. Do not designate one visually pleasing image as the truth simply because its measured width matches the nominal drawing.
Freeze the processing rule before evaluating an acceptance set. If the rule changes after viewing failures, retain the original results and reevaluate the affected set consistently. Avoid one threshold for passing parts and another for failing parts. A material-dependent algorithm may be legitimate, but its selection conditions must be known from the specimen identity or validated image properties rather than the outcome it produces.
Report where the width was measured
A single mean can hide a local neck or a tapered end. Retain width against position and identify interruptions near conductor overlap, glass coverage or a trim cut. Use the drawing-defined region and distinguish a local minimum from the average over a straight body. A mask that bridges a narrow gap during smoothing can erase the very condition the inspection is meant to find.
Record any filtering, morphological closing or rejection of small regions. Those operations can remove isolated noise but also change true thin features. Challenge them with relevant edge shapes before use. Do not transfer a validated rule from a broad uncoated resistor to a narrow overglazed structure without showing that the required boundaries survive the complete processing chain.
Use resistance as corroboration, not an optical ruler
Relate a width observation to the correct electrical path, temperature and material state when electrical interpretation matters. Resistance can change with length, thickness, composition, firing history and trimming as well as width. A normal resistance reading does not prove that a selected image threshold has found the correct physical edge, particularly where a trim operation compensates for other variation.
Conversely, an optical width difference need not predict a proportional resistance change when the peripheral material conducts differently from the central film. Compare specimens under controlled conditions and keep the optical and electrical questions separate. Use the established geometry-design owner for resistor sizing; this inspection record should explain how a reported width was obtained and whether its boundary definition is stable.
Deliver the profile and sensitivity record with the width
Provide the original image, measurement coordinates, selected channel, score convention, algorithm version and threshold rule. Include representative line profiles, mask overlays and the result of the controlled threshold sweep. Report the sensitivity alongside calibration and repeat-capture information without automatically adding every observed range as though it were an independent uncertainty component.
For a thick-film resistor drawing review, identify the width feature that affects the application and the surface state in which it will be inspected. ChipSimple can review the proposed construction and inspection requirement by drawing. The useful handoff is a repeatable physical boundary convention with evidence of its limitations, not an unsupported claim that an image algorithm measures every printed edge to the same precision.
Specify the resistor edge to measure
Supply the drawing feature and authentic images before selecting a measurement threshold.
- Resistor drawing, layer construction and width acceptance region.
- Native image, pixel scale and capture settings.
- Current segmentation rule, overlays and line profiles.
- Available electrical results with specimen identity and temperature.
The drawing-upload form loads as you reach this section.