
On this page
A registration adjustment can remove a systematic offset while leaving repeatability unchanged. A spreadsheet may nevertheless report that variation has become much worse because it divides the same standard deviation by a mean now close to zero. That coefficient of variation is answering the wrong question for signed alignment errors. Keep centering, spread and functional clearance separate instead of ranking a better-centered print as a worse process.
Measurement purpose
Prevent near-zero residual means from creating misleading relative-repeatability reports.
Specimens and conditions
- Residual definition
- Fixed drawing frame and comparable feature/repeat conditions.
- Before/after comparison
- Retained raw data and explicit common correction or process change.
Equipment and records required
- Registration measurement: Known coordinate calibration and measurement contribution.
- Report calculation: Defined sample variance, RMS and normalization conventions with boundary tests.
Method sequence
- Define metrics
Separate bias, spread and functional clearance questions.
Record: Metric definitions and units.
- Calculate
Avoid a near-zero residual mean as the normalization denominator.
Record: Absolute quantities and any fixed scale.
- Challenge
Test unit conversion, recentering and sign/zero cases.
Record: Invariance tests and corrected report.
Decision and uncertainty
Use statistics that preserve their intended meaning under valid recentering and unit changes.
Choice of statistic does not remove measurement error or establish independent process sampling.
Metrology and registration process owners.
Traceable outputs
| Record | Required contents |
|---|---|
| Registration summary | Signed bias, spread, optional RMS and fixed normalization basis. |
| Report verification | Raw observations and zero/sign/unit/centering tests. |
Method review decisions
- Do not normalize signed residual spread by its own mean when the desired mean is zero.
- Report bias and spread in the drawing's length units before introducing percentages.
- Use a fixed, meaningful comparison scale when a normalized report is necessary, and preserve the unnormalized values.
Ask what the reported percentage is intended to compare
A registration report may need to show how far the process is displaced, how repeatable successive prints are, or how much functional clearance remains. Those are separate quantities. Before selecting a percentage, state which decision it should support. A convenient spreadsheet statistic can hide that distinction when it reduces every column of coordinates to one relative variation number.
Use signed residuals in a defined drawing frame rather than raw image coordinates. An image-coordinate origin can be moved without changing the physical print. Dividing spread by the mean of those coordinates would make the result depend on where the camera places zero. That alone demonstrates why an apparently dimensionless number is not necessarily a meaningful comparison of registration quality.
Recognize the denominator in coefficient of variation
The sample coefficient of variation is the sample standard deviation divided by the sample mean. It can be useful for suitable positive ratio-scale quantities whose mean provides a meaningful physical scale. It is not automatically suitable for signed deviations centered on a target of zero. As the mean approaches zero, the ratio becomes highly sensitive to a tiny change in centering.
Replacing the mean with its absolute value only removes a negative sign. It does not solve the near-zero denominator. Likewise, adding a small constant to avoid division by zero changes the statistic according to an arbitrary software choice. If a result becomes undefined at the desired alignment condition, redesign the report rather than hiding the numerical problem behind an epsilon.
Compare the same spread before and after removing a bias
Consider three illustrative X residuals of 9, 10 and 11 micrometers. Their mean is 10 micrometers and their sample standard deviation is 1 micrometer. The numerical coefficient of variation is 0.1, or 10 percent. Now subtract a correctly identified common 10-micrometer offset. The residuals become minus 1, zero and plus 1 micrometer.
The corrected mean is zero and the sample standard deviation remains 1 micrometer. Repeatability did not deteriorate; the systematic offset was removed. Yet CV is now undefined. If the corrected mean were a small positive value instead, the same spread could create an enormous percentage. The example demonstrates the arithmetic only and does not define a print-registration tolerance or a validated correction procedure.
| Illustrative residuals | Mean bias | Sample standard deviation | CV interpretation |
|---|---|---|---|
| 9, 10, 11 µm | +10 µm | 1 µm | Numerically 10%, but not a useful residual-quality scale |
| −1, 0, +1 µm | 0 µm | 1 µm | Undefined, despite better centering |
| −0.99, 0.01, 1.01 µm | +0.01 µm | 1 µm | Numerically 10,000%; denominator artifact |
| Coordinates shifted by an arbitrary origin | Mean changes | Spread unchanged | Coordinate CV is origin-dependent |
Report mean residual and spread as two outputs
Keep the mean signed X and Y residuals as centering information and their repeatability statistics as spread information. Retain the raw coordinate pairs and measurement conditions. A small mean does not prove that individual prints are close to target, and a small standard deviation does not prove that a stable process is centered. Either can look favorable while the other creates a real assembly problem.
Do not average residuals from unrelated features into one common mean if their spatial pattern carries the engineering information. Opposite corners can cancel because of rotation or scale error. First use the appropriate existing geometric analysis, then summarize comparable repeat observations. This page addresses the reporting denominator, not how to fit a rigid transformation or establish the source of screen drift.
Use a combined metric only when its meaning is useful
If a report needs one magnitude describing error relative to zero, root mean square can combine bias and spread without dividing by the mean. Define RMS as the square root of the average squared residual, using n in that average. For the three uncorrected values, RMS is the square root of 302/3, approximately 10.0333 micrometers. For the corrected values it is the square root of 2/3, approximately 0.8165 micrometer.
This RMS is not the sample standard deviation, which uses n−1 after subtracting the sample mean. For these three points, RMS squared equals mean squared plus two-thirds of sample variance. The decrease in RMS reflects removal of bias, while the sample spread remains unchanged. Do not claim that an RMS requirement automatically protects a worst-case edge or every printed feature; it remains an aggregate metric.
RMS² = mean(e)² + [(n−1)/n] s²
- e: signed residual observations in a common length unit; n: their count, greater than one.
- s: sample standard deviation calculated about the sample mean with denominator n−1.
- RMS: sqrt[sum(e_i²)/n], an error-to-zero magnitude in the same length unit.
An algebraic identity for the stated observations. It does not assign independence, normality, confidence or a future-part acceptance probability.
Normalize to a declared fixed scale when comparison requires it
When a dimensionless comparison is needed, choose a scale that does not move merely because the process becomes centered. For example, a report might divide residual spread by a fixed, explicitly defined engineering length. The scale could come from a relevant feature requirement, but must have the same meaning for every group being compared. Report both the ratio and its numerator and denominator.
A fixed scale of 20 micrometers with a 1-micrometer standard deviation gives a ratio of 0.05, or 5 percent, both before and after the example's bias correction. That scale is hypothetical and is not a tolerance recommendation. Do not relabel this simple normalized spread as a capability index. Capability assessment has additional distribution, stability and specification requirements that a percentage alone does not establish.
Test report invariance before comparing printers or shifts
Challenge the calculation by expressing the same residuals in millimeters instead of micrometers. Absolute outputs should rescale consistently, while a ratio using a correspondingly converted fixed length should remain unchanged. A change in coordinate origin should not change spread. A common centering correction should change bias but not the spread of otherwise unchanged observations.
Also check how the report handles zero, a small signed mean and a sign reversal. Confirm that a negative CV is not interpreted as negative variation or better quality. Keep sample size, repeated-frame versus independent-print identity and measurement uncertainty visible. A stable formula cannot turn repeated camera frames into independent production observations or remove an unresolved measurement contribution.
Deliver a report that explains the correction rather than contradicting it
The final report should state the residual coordinate, mean bias, spread definition, any RMS value and any fixed normalization scale. Include the relevant functional feature comparison separately. Keep before-and-after raw data so another reviewer can see whether the adjustment changed only centering or also altered local distortion and repeatability.
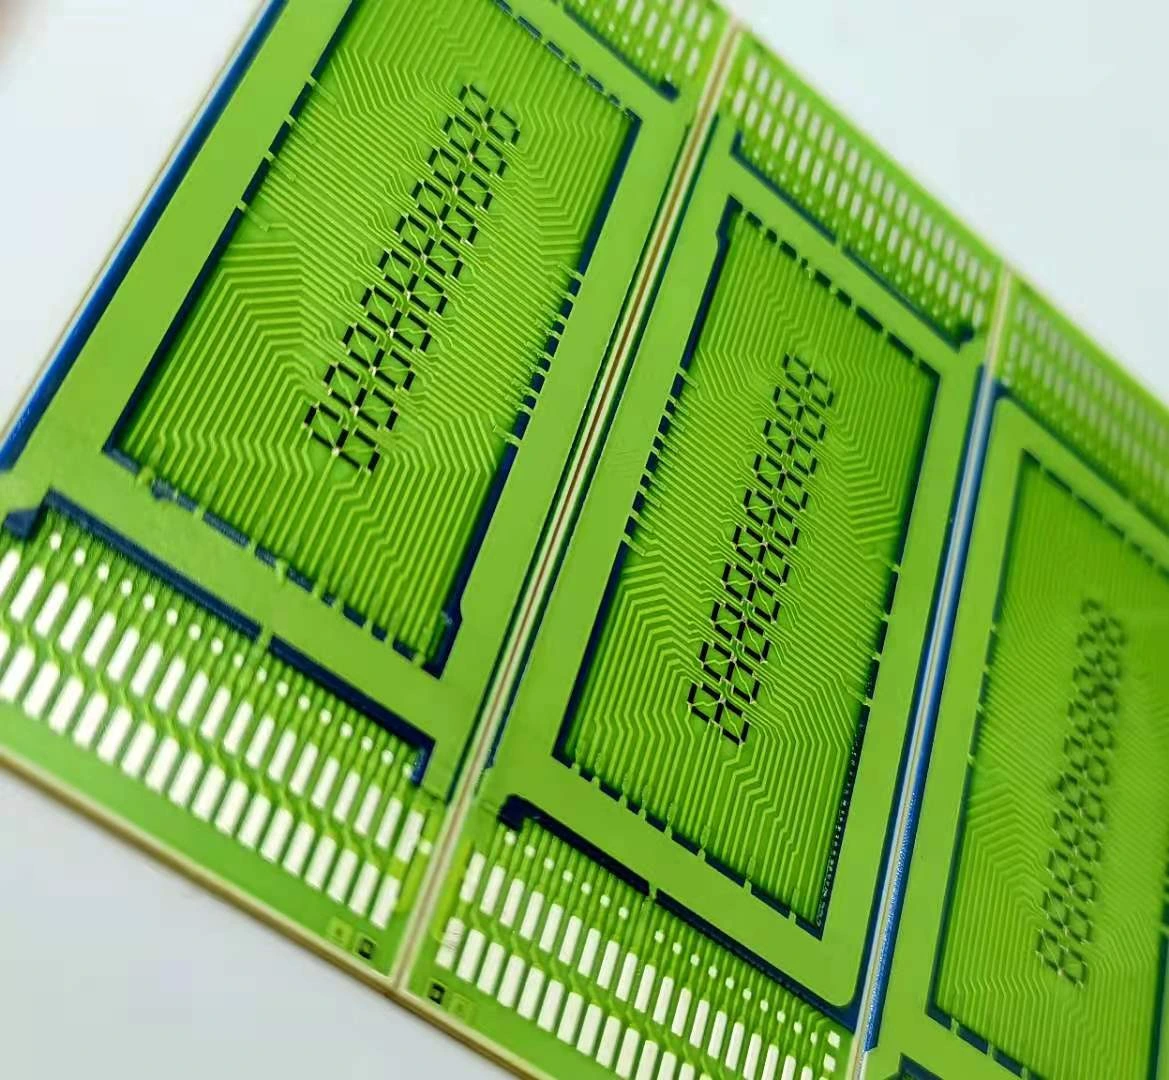
For a thick film screen-print registration review, provide the drawing datums, measured features and acceptance relationships with the statistical output. The useful result is a report whose numbers retain their meaning when alignment improves. It should help distinguish a genuine process change from a denominator artifact, without assigning machine accuracy or production capability that the underlying observations do not demonstrate.
Provide the registration report and its formulas
Include the data behind any relative variation percentage.
- Drawing frame, feature identities and signed residual observations.
- Before/after adjustment records and independent-repeat structure.
- Exact mean, spread, RMS and percentage formulas.
- Fixed comparison scale, functional clearances and measurement uncertainty.
The drawing-upload form loads as you reach this section.