
On this page
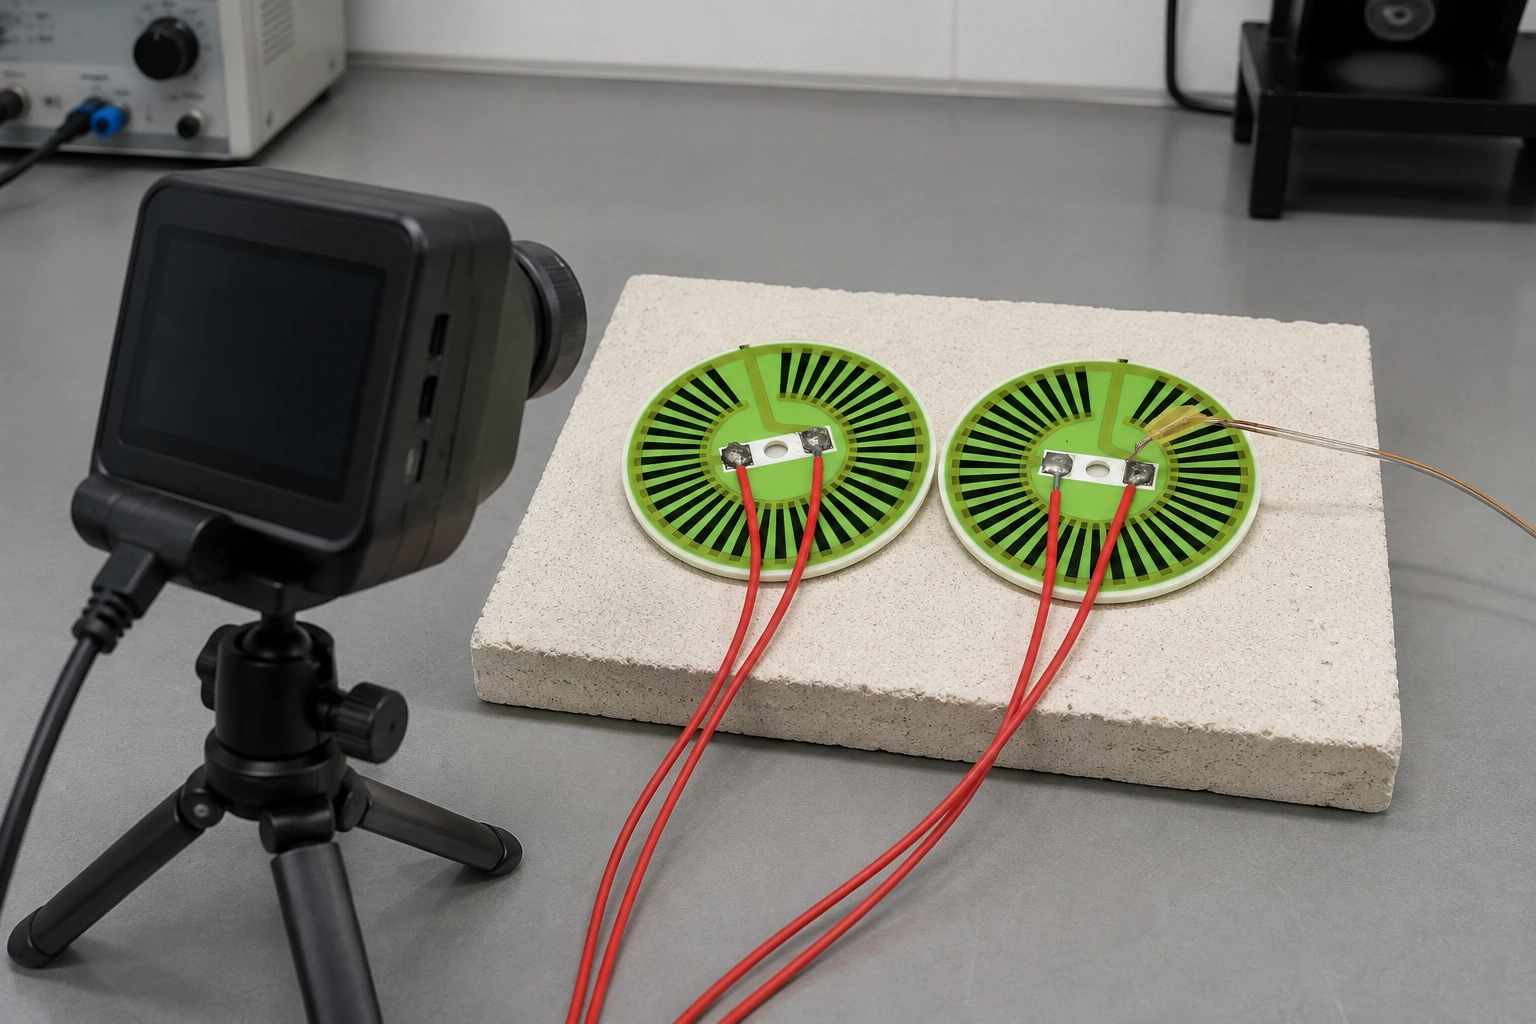
A thermal image is a measurement of infrared radiation interpreted through an instrument model. On a heater containing glass glaze, exposed metal pads and ceramic, adjacent colors can reflect different optical properties rather than different temperatures. Reliable uniformity calculations begin by separating the temperature field from emissivity, reflected radiation, spatial resolution and the effects of contact sensors.
Key design decisions
- Assign measurement regions by surface material before calculating uniformity.
- Verify that the optical measurement spot resolves the feature being reported.
- Use contact sensors as a controlled cross-check, accounting for their own heat-flow disturbance.
State which surface and statistic are being measured
Define the functional area, operating condition and temperature statistic before collecting images. A full substrate image, the electrically active pattern and the usable heated zone are different regions. Record whether the reported value is a maximum pixel, a regional average, a spatial percentile or the spread between defined locations. Keep terminal and mounting regions identifiable even when they are excluded from a usable-zone metric.
Capture the relevant time interval. A steady-state uniformity calculation cannot represent startup overshoot or a transient dry area. Specify the stabilization rule in terms of measured behavior, and retain the time trace used to establish it. An attractive image selected from a sequence is not a reproducible measurement condition.
Separate surfaces with different emissivity
Glaze, ceramic, exposed conductor and oxidized metal can have different emissivity in the camera's spectral range. Their apparent temperatures may therefore differ at the same physical temperature. The visible green color of a glass overglaze does not supply an infrared emissivity value. Surface finish, angle and temperature can also affect the measurement.
Establish an emissivity approach for each region that contributes to the result. A suitable high-emissivity patch can help on an accessible area if its temperature follows the underlying surface and its use is compatible with the specimen. Document the patch material, location and attachment. Do not coat an entire functional surface without considering whether the coating changes heat loss, electrical behavior or the condition being tested.
Control reflected surroundings
Low-emissivity surfaces can reflect radiation from operators, lights, windows and nearby hot equipment. Moving the camera or a warm object and observing a moving apparent hot spot is a useful diagnostic, although it does not replace a quantified setup. Keep the camera angle and surrounding geometry consistent between images used for comparison.
Account for reflected apparent temperature using an appropriate measurement procedure for the camera and scene. Ambient air temperature alone is not necessarily the reflected-radiation condition. Record nearby hot and cold surfaces, shields and enclosures. If a shield is added to stabilize reflections, verify that it has not also changed airflow or the specimen's radiative heat loss.
Respect the camera measurement footprint
The smallest visible feature is not necessarily the smallest feature that can be measured accurately. A hot printed turn occupying only part of the effective measurement spot is averaged with its cooler surroundings. Digital zoom enlarges the displayed pixels but does not recover the missing spatial information. Select lens, distance and focus from the size of the feature that drives the decision.
Record camera model, lens, distance, angle and image dimensions. Check focus on the heater surface rather than on a nearby fixture. For an oblique view, the footprint and apparent dimensions change across the image, so a far-edge trace may be less well resolved than a near-edge trace. Compare local peaks only when the spatial sampling is adequate and consistent.
Use contact sensors without treating them as perfect truth
A bonded thermocouple or resistance sensor offers a different measurement route, but it can conduct heat away through its wires and alter the local surface with its attachment. Contact pressure, adhesive thickness and junction position affect the result. A sensor on the back of the plate does not directly measure the printed face when there is a through-thickness gradient.
Use fine, appropriately routed leads where the installation permits, and document the attachment. Compare the contact reading with a camera region large enough to represent the actual sensor location while avoiding the sensor body itself. Evaluate the time response during a controlled transient; two sensors that agree after a long dwell can still disagree substantially during startup.
| Observed pattern | Likely measurement concern | Discriminating check |
|---|---|---|
| Metal pad appears cold beside glaze | Different emissivity or reflected radiation | Compare a compatible emissivity treatment or independent local measurement |
| Hot spot moves when the camera moves | Reflection from the surroundings | Hold electrical conditions and change the reflecting geometry |
| Peak rises as camera distance decreases | Feature is spatially under-resolved | Verify measurement spot size and focus |
| Contact sensor reads low during warm-up | Response lag or wire heat sinking | Compare transient response and attachment geometry |
| Back-face sensor agrees only at steady state | Through-thickness gradient changes during the transient | Use synchronized front and back measurements |
Build an uncertainty budget around the decision
List contributions from instrument calibration, emissivity, reflections, focus, target size, region selection, temporal stability and contact-sensor installation. Some errors affect all pixels similarly, while others change the apparent spatial spread. A common offset may have a smaller effect on uniformity than an emissivity difference between two neighboring materials.
Repeat measurements after repositioning the camera and remounting any removable sensor to expose setup sensitivity. Report the measurement variation alongside the uniformity result. If the allowable spread is comparable to the uncertainty, improve the method or revise the decision rule; reporting extra decimal places does not resolve the ambiguity. Keep raw radiometric files when the camera provides them so settings can be reviewed.
Calculate from controlled regions and raw data
Apply the same spatial mask and time-selection rule to every specimen in a comparison. Do not remove isolated high pixels merely because they worsen the result; determine whether they represent noise, reflection, a real defect or an unresolved feature. Document any exclusion with its physical reason and retain the original image.
Use an image overlay that distinguishes the usable area, sensor points and excluded hardware. Pair the colored map with the numeric scale and the actual temperature statistics. Automatic rescaling can make two very different temperature spreads look similar, so use a shared scale when visual comparison is part of the engineering decision.
Make the result reproducible
The thermal-map report should identify specimen construction, surface condition, electrical terminal power, mounting, load, airflow, stabilization, camera settings and sensor details. State which parts of the image were suitable for quantitative measurement and which were used only to locate features. This is a measurement boundary, not a statement about the heater's manufacturing quality.
Finally, connect the temperature map to the application requirement. A narrow local peak may matter for film stress even when the usable-zone average is acceptable. A broad edge depression may matter more for a heated sample. Preserve both the map and the functional interpretation so later geometry changes are evaluated against the same requirement.
Define a heater thermal-mapping method
Send the surface construction and uniformity requirement so the measurement regions, optics and cross-checks can be selected appropriately.
- Heater drawing showing glaze, exposed conductors and functional heating area.
- Required temperature statistic and startup or steady-state condition.
- Camera, lens, distance, viewing angle and available radiometric files.
- Contact-sensor type, attachment and exact measurement locations.
- Input power, load, mounting and surrounding thermal conditions.
The drawing-upload form loads as you reach this section.