
On this page
A plate heater often loses heat differently at its perimeter than at its center. Edges, fasteners, lead exits and surrounding air can draw energy away from a region that receives the same nominal electrical power per area as the rest of the plate. Uniformity should therefore be specified over a defined useful zone and assessed with a measurement plan that can identify the boundary responsible for the observed temperature pattern.
Key design decisions
- Define the usable heated zone before selecting a measurement grid.
- Separate local edge losses from insufficient total input power.
- Compare temperatures with the actual load and mounting conditions installed.
Draw the useful zone and the physical boundaries
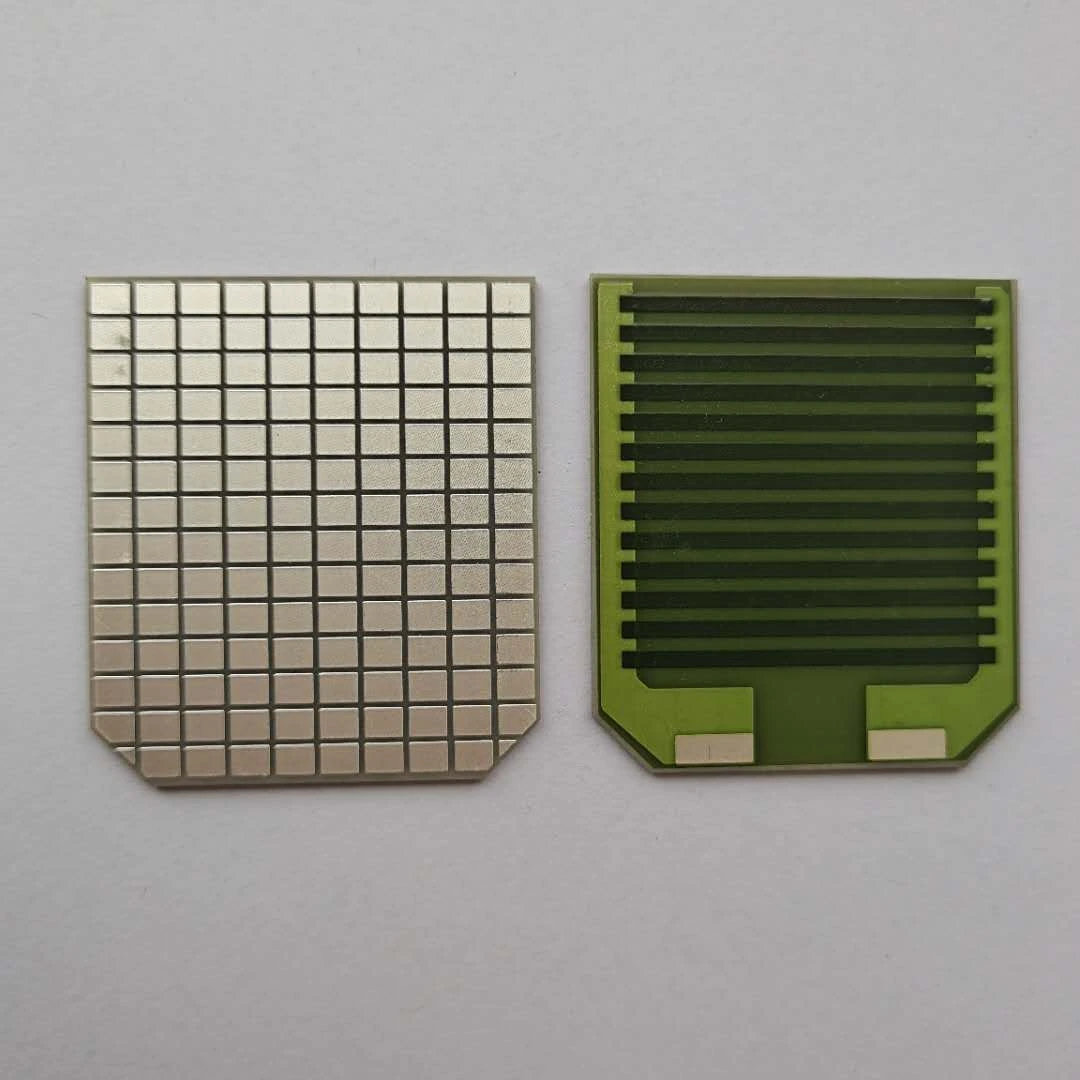
Mark the region that must heat the process, rather than assuming that every millimeter of the substrate outline needs identical temperature. Terminal areas, mounting margins and openings may deliberately remain cooler. These exclusions should be visible on the drawing so the uniformity result cannot be improved later by silently discarding inconvenient points.
Also mark which edges contact a housing or fixture and which are exposed to air. A symmetric plate outline does not imply symmetric thermal boundaries. One clamped side can draw substantially more heat than a free side. The first thermal map should preserve that orientation and identify the load interface, sensor positions and cable exit in the same coordinate system.
Understand why a uniform pattern gives a nonuniform plate
Local temperature depends on both generated heat and the available heat-removal paths. A perimeter has sidewall area that the interior lacks, and a nearby support may provide another conductive path. The plate also spreads heat laterally, linking a cooled edge to neighboring active regions. These effects can produce a gradient even when electrical power is distributed evenly.
Increasing all-zone power raises the center as well as the edge. It may bring the edge toward target while pushing the center above its limit. Before changing resistor artwork, examine whether an unintended contact, airflow path or terminal heat sink is responsible. Electrical redistribution is most useful after the mechanical and thermal boundaries are understood and repeatable.
Build a grid that can distinguish the mechanisms
Place points at the center, along the useful-zone boundary, close to suspected sinks and on both sides of relevant geometric transitions. A coarse regular grid can miss a narrow hot strip or a steep edge gradient. Add locally denser measurements where the trace layout or mounting suggests such behavior.
Keep the position of each point relative to the active pattern and load contact area. Repeat selected measurements after remounting to determine how strongly contact repeatability affects the map. A good map should let an engineer ask whether the gradient follows the electrical pattern, the fixture or a specific material transition. An attractive thermal image without coordinates and operating conditions cannot answer that question.
State the statistic and the region together
Mean temperature, maximum temperature and maximum-to-minimum spread describe different aspects of a plate. A mean near target can coexist with a small overheated region. A single maximum-to-minimum value can also be dominated by an intentionally inactive terminal region outside the useful load area. Report the region associated with each statistic.
For discrete points, decide whether an ordinary mean is appropriate or whether the measurements represent unequal areas. A dense cluster at the center should not outweigh a sparsely measured edge merely because more points were sampled there. When infrared pixels are used, mask holes and unrelated background explicitly. Retain the mask and raw temperatures with the calculation.
| Question | Required observation | Interpretation to avoid |
|---|---|---|
| Does the useful load region meet its temperature range? | Minimum and maximum within the declared load-contact zone at the specified operating state. | A whole-image average that includes background, inactive margins or a cool connector. |
| Is one edge overcooled by the mounting? | Profiles approaching that edge, the adjacent fixture temperature and a matched mounting comparison. | Attributing an asymmetric map automatically to an asymmetric resistor pattern. |
| Does startup create a short-lived local peak? | Time-resolved maximum and spatial position during the full power ramp. | Using the final steady map as proof that the ramp has no hot spots. |
| Will assembly variation change uniformity? | Repeated maps after controlled remounting with the same electrical and environmental conditions. | Treating one unusually good contact condition as the repeatable production result. |
Test the load interface before compensating the edge
Repeat the map with the intended load in place. A bare plate can lose heat by air and radiation while the installed plate mainly transfers heat through contact. Contact can be uneven because of flatness, fastener sequence, adhesive thickness or trapped air. These effects may change both the center temperature and the apparent edge deficit.
A targeted comparison can isolate a suspected boundary: alter one support contact, shield one airflow path or improve a known interface region while keeping other conditions fixed. Record input power and load temperature so the result is not confused with a controller adjusting output. If an edge gradient disappears with better contact, the production solution must control that contact, not simply reproduce the test’s nominal power.
Redistribute heat only against a stable loss map
Once boundaries are repeatable, the pattern can be reviewed for regional power allocation. Define the objective as a useful surface-temperature distribution, not an equal trace density everywhere. Regions close to genuine sinks may need a different electrical allocation from the center. The allowable pattern change remains constrained by conductor current, resistor temperature and available active area.
Check multiple operating conditions. A pattern that compensates an edge at maximum flow or strong cooling can overheat that region when the load is absent or airflow changes. The selected design should include an operating envelope and an appropriate abnormal-condition response. Control zoning may be worth considering if one static distribution cannot accommodate the required range.
Control the measurement and the final acceptance condition
Infrared observations require appropriate emissivity and reflected-temperature treatment for each visible surface. Bare metal, glassy coating and adhesive may not read alike at the same true temperature. Contact sensors also have attachment and lead-conduction errors, so cross-check the map using a method appropriate to the required accuracy.
The final acceptance statement should identify the useful zone, maximum local temperature, allowed spread, load, mounting, electrical input and time condition. Include whether the requirement applies during startup, after settling or throughout a duty cycle. This makes the thermal result transferable to the equipment assembly and prevents a later design change from inheriting a uniformity claim obtained under a different boundary.
Send the useful zone and boundary conditions
A plate-uniformity review needs the location of the useful heated area and the thermal paths around its perimeter.
- Plate and load drawings identifying the active pattern, excluded terminal areas, openings and useful temperature-controlled region.
- Support, clamp and interface details, including which edges contact metal hardware and which are exposed to moving air.
- Temperature target, permitted local maximum, uniformity statistic, startup or steady-state criterion and electrical operating conditions.
- Coordinate-based thermal maps with sensor details, emissivity settings when relevant, load condition and repeated mounting observations.
The drawing-upload form loads as you reach this section.