
On this page
Two rectangular printed resistors can have the same length-to-width ratio and the same nominal resistance while responding very differently to printing variation. A fixed edge error represents a larger fraction of a narrow resistor than of a wide one. Aspect-ratio selection therefore requires both the electrical ratio and the physical dimensions. The useful design question is how the measured process variation changes resistance, area, power distribution and the available trim margin.
Key design decisions
- Use processed width and electrically defined length, rather than artwork dimensions alone, in sensitivity calculations.
- Separate systematic edge bias, random dimensional scatter and sheet-resistance variation.
- Preserve covariance information when length and width change together; do not automatically add independent-error estimates.
Equal square counts do not imply equal sensitivity
For a uniform rectangular film, resistance is approximately sheet resistance multiplied by length divided by width. A two-by-one-millimeter rectangle and a four-by-two-millimeter rectangle both contain two squares. Under the ideal model they have the same resistance, but the larger rectangle has four times the area and smaller fractional sensitivity to a given absolute edge displacement.
This does not establish that the larger resistor is always preferable. It consumes more substrate, may change thermal coupling and may encounter a different thickness distribution during printing. Treat equal-ratio patterns as candidates for comparison, not interchangeable geometries. Their shared nominal resistance is only the first condition in a useful design study.
Use signed sensitivity to identify the dominant dimension
Differentiating the rectangular model gives fractional resistance change approximately equal to fractional sheet-resistance change plus fractional length change minus fractional width change. The signs matter. A longer printed body raises resistance, while a wider body lowers it. If both dimensions expand by the same percentage, their first-order effects cancel in the ideal geometry term.
For an assumed two-millimeter length and 0.5-millimeter width, a positive 0.02-millimeter change in length adds about one percent. The same positive change in width subtracts about four percent. A drawing tolerance with identical numerical limits on both dimensions therefore does not allocate equal electrical error. This calculation helps direct measurement effort toward the width when its fractional contribution is larger.
ΔR/R ≈ ΔRs/Rs + ΔL/L − ΔW/W
- R is resistance and Rs is sheet resistance in ohms per square.
- L and W are the effective processed length and width.
- Each delta is a small signed change from the chosen nominal condition.
The resistor is approximately rectangular and uniform, changes are small, and end effects and local constrictions are handled separately.
Check the exact ratio when variations are not small
First-order estimates become less reliable as dimensional changes become a substantial fraction of the feature. For a nominal width of 0.5 millimeter, reducing width by 0.05 millimeter increases the width-related resistance factor to 0.5 divided by 0.45, or approximately 1.111. The exact increase is 11.1 percent rather than the ten percent given by the linear approximation.
Use the exact rectangular ratio to evaluate drawing extremes: the highest geometry resistance uses maximum length and minimum width, while the lowest uses minimum length and maximum width. Apply sheet-resistance bounds separately and state whether the extremes can occur together. If the actual pattern contains a local neck, an average width may still understate its effect; inspect the full profile before trusting either calculation.
Separate edge bias from part-to-part scatter
A consistent printed edge expansion shifts the average value and may be compensated in artwork after qualification. Random edge variation broadens the distribution and cannot be removed by one nominal correction. Mixing these effects into one tolerance number obscures whether a design change should recenter the process or make it less sensitive.
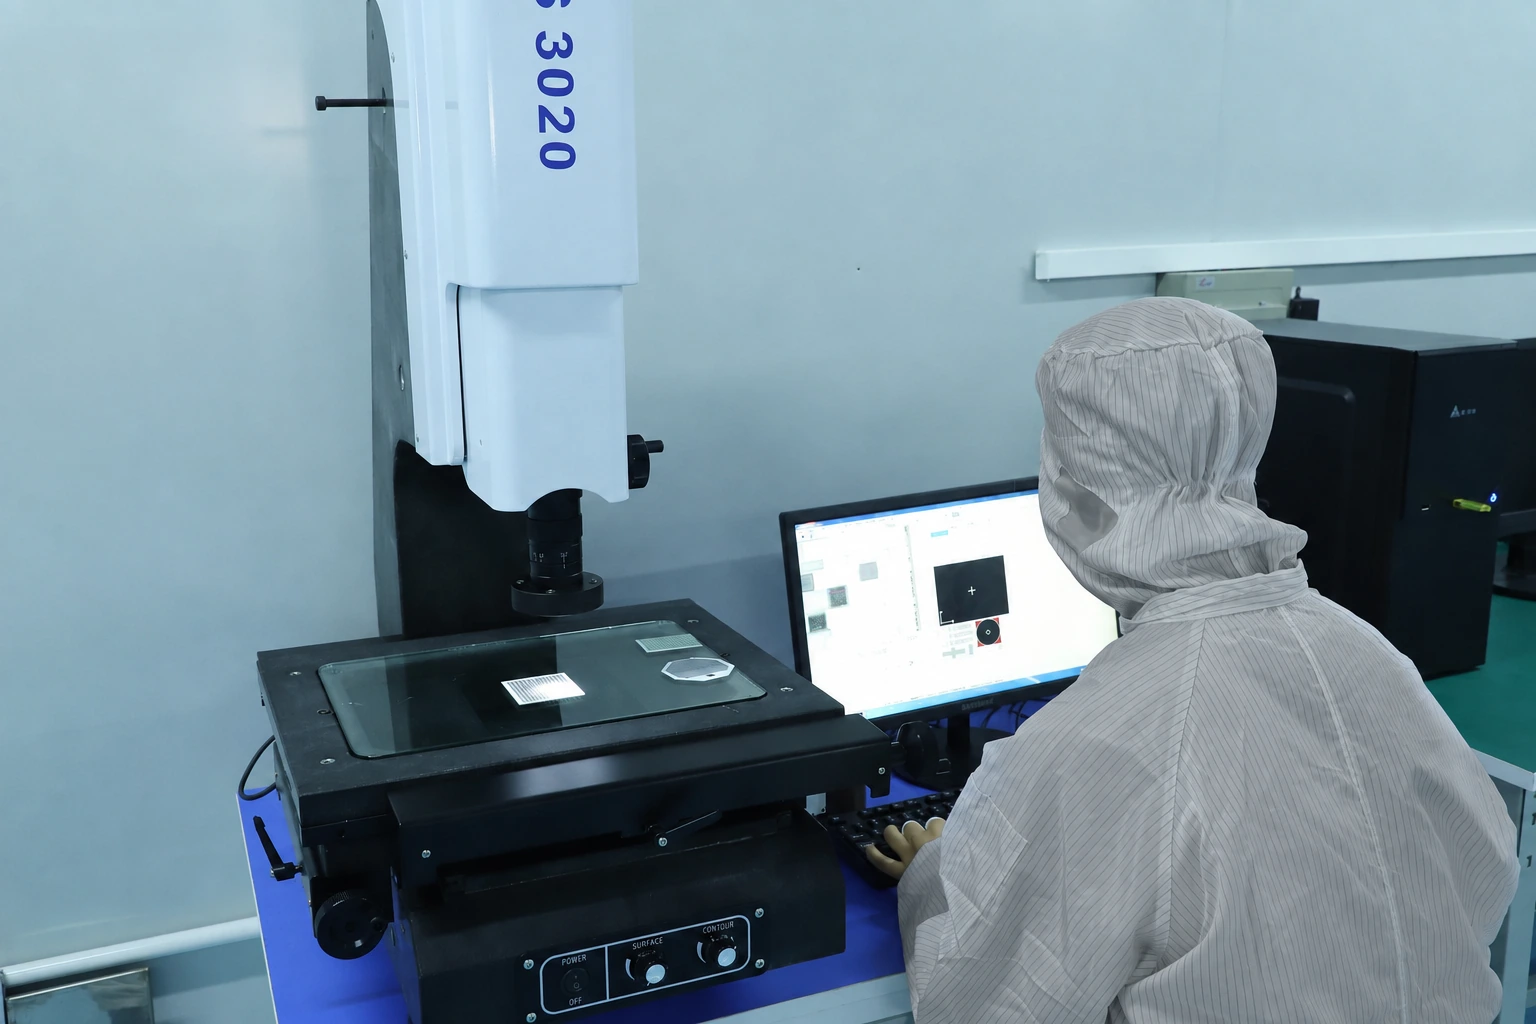
Measure repeated widths at consistent locations and report the method used to define a partly diffuse edge. Include measurement repeatability, because uncertainty in edge detection can look like printing variation. A resistor with rough edges may require a profile-based assessment rather than one caliper dimension. Retain images and electrical data together so the chosen dimensional metric can be checked against the resistance it is intended to predict.
Retain relationships between the measured variables
If a common print condition makes length and width grow together, their resistance effects can partially cancel. If it lengthens the body while narrowing it, the effects reinforce. Include the relevant sensitivity coefficients and covariance when propagating dimensional uncertainty. Combining measured standard deviations as if every variable were independent can misstate the resulting uncertainty.
Use paired observations from the same resistor or coupon. Calculate the geometry predictor for each measured length and width, then compare it with actual resistance. When sheet resistance is measured elsewhere on a panel, check whether it represents the same local process condition. A convenient independent reference may fail to capture the thickness or firing variation experienced by the resistor itself.
Choose the geometry change that reduces the actual error source
A dimensional tolerance budget should lead to a practical choice. Compare the sensitivity of each candidate using the observed variation, then consider footprint and processing constraints. The best next design is the one whose dominant error can be controlled and verified.
| Measured pattern | Design or process response | Condition to preserve |
|---|---|---|
| Width scatter dominates fractional error | Increase width and proportionally increase length | Retain nominal square count and verify the larger print |
| Mean dimensions are biased but scatter is small | Evaluate an artwork offset using processed measurements | Do not tighten tolerances merely to correct the mean |
| Length and width move together | Use paired data and covariance in the estimate | Keep common process conditions in the comparison |
| Short resistors deviate from the rectangular model | Separate terminal contributions before rescaling | Use the same electrical length and sense boundary |
| Local necks dominate despite stable average width | Control edge formation and minimum local width | Retain a profile inspection linked to electrical behavior |
Compare a family of equal-ratio coupons
A useful coupon family keeps the aspect ratio fixed while changing absolute scale. Distribute repeats across the substrate and process them together. Measure final dimensions, resistance at low excitation and any relevant trim requirement. This directly tests whether the expected reduction in fractional edge sensitivity appears in the real material process.
Do not judge only the mean resistance. Compare spread, outliers, physical defects and the relationship between electrical error and measured dimensions. If the larger geometry has lower dimensional sensitivity but greater sheet-resistance variation, the overall improvement may be smaller than expected. Follow the electrical comparison with the application's power and mounting assessment, because equal resistance does not mean equal local power density or temperature.
State tolerances in terms that can be inspected and used
The drawing should identify which dimensions are controlled before trimming and which electrical limits apply afterward. A trim operation can correct initial value but does not erase uncertainty about narrow necks, local heating or the remaining physical path. Keep the dimensional requirement connected to the property it protects.
For an RFQ, provide nominal dimensions, available area, target resistance and existing processed measurements. Include any covariance or location trend that is already visible. That allows geometry, material choice and adjustment margin to be reviewed together. Avoid assigning a universal minimum width from this sensitivity model; printability and useful tolerances depend on the selected material, screen, substrate and qualified process.
Send the dimensional resistance budget
Provide paired geometric and electrical data so the dominant sensitivity can be identified.
- Nominal and measured resistor width, length and terminal length definition.
- Resistance target, initial distribution and final tolerance requirement.
- Edge-measurement method, repeated measurements and observed systematic bias.
- Paired length-width data and any local sheet-resistance measurements.
- Available footprint, trim region, drive condition and mounting constraints.
The drawing-upload form loads as you reach this section.