
On this page
Removing electrical power does not instantly remove heat stored in an assembly. A ceramic circuit beside hotter hardware can continue warming after its own input reaches zero. The relevant shutdown question is therefore the highest subsequent circuit temperature, not simply its temperature when a switch opens. A two-node energy balance exposes when heat soakback is possible and what must be measured to separate it from sensor lag or residual electrical input.
Key design decisions
- Record the initial temperatures of the ceramic and adjoining thermal masses rather than assigning one starting temperature to the whole assembly.
- Observe the full shutdown transient until the critical temperature peak has passed under the intended cooling state.
- Distinguish stored-energy transfer from ongoing electrical heating, changed cooling boundaries and delayed temperature measurement.
Define how the neighboring hardware becomes hotter
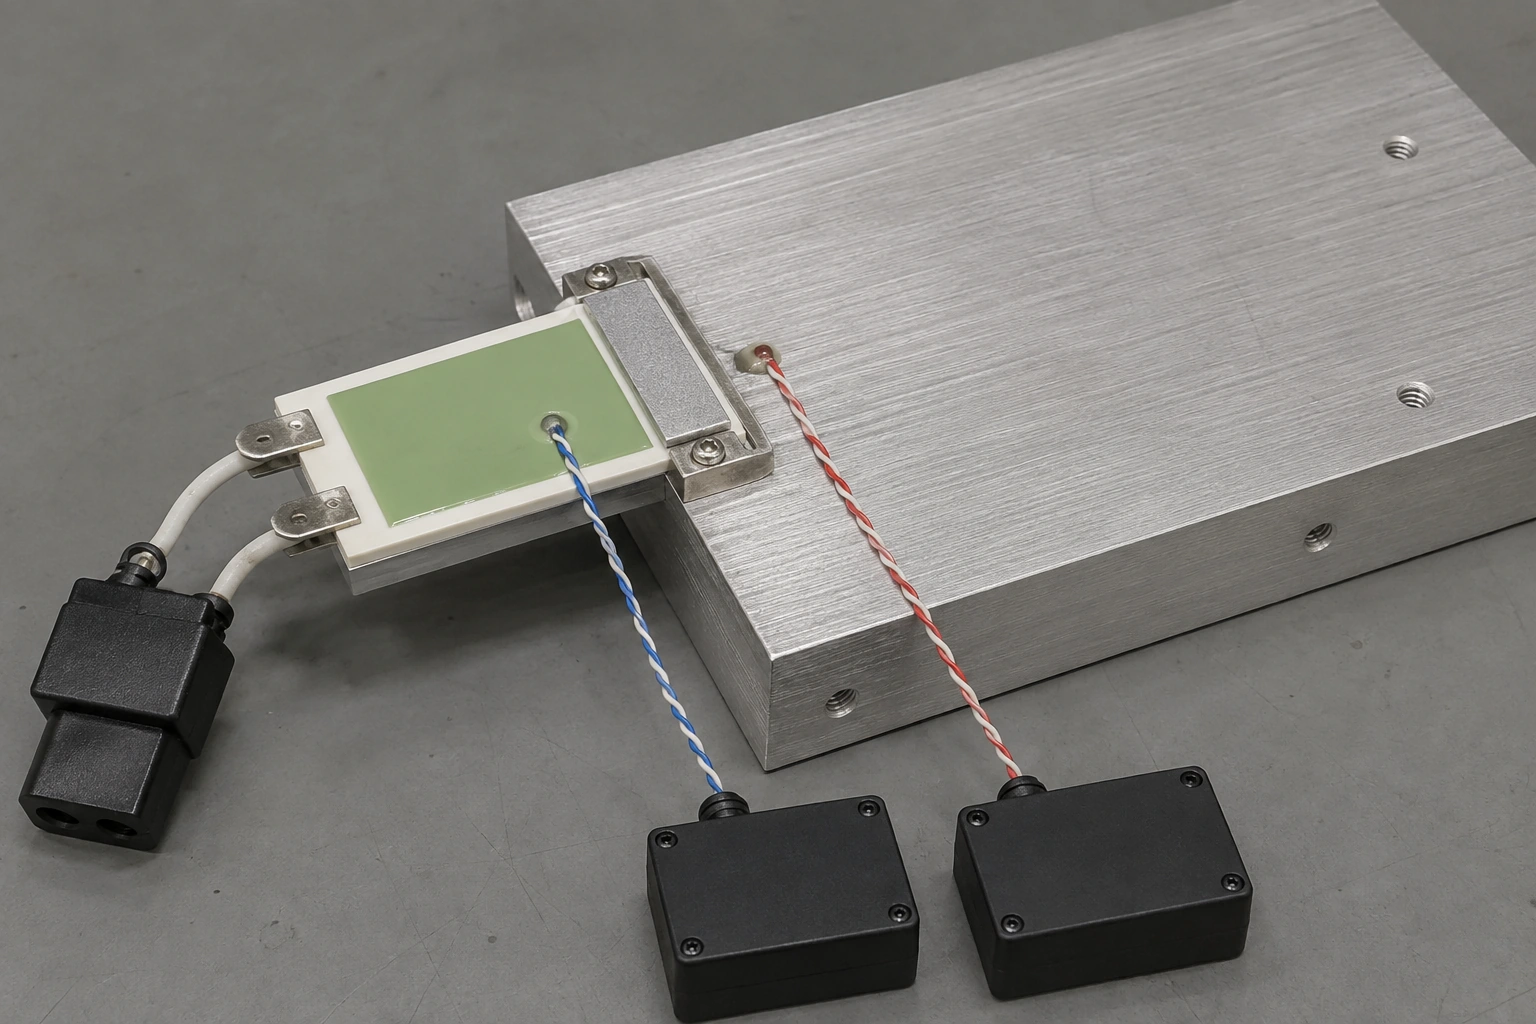
A surrounding block may have been heated by another component, process chamber or operating stage while the ceramic circuit was held cooler. When operation changes, that initial temperature difference can drive heat toward the circuit. Document the preceding operating state that makes this difference plausible. Do not assign a hotter support to a calculation and then describe it as the inevitable shutdown behavior of a heater whose support was actually cooler.
Power-off also needs a boundary definition. The circuit may lose electrical input while a neighboring source remains energized, or a fan may stop at the same event. Those are different scenarios from a completely unpowered assembly cooling under unchanged conditions. Name the sources and cooling functions that remain active, and retain the actual shutdown sequence.
Give each participating body its own stored energy
Represent the ceramic region of interest by temperature Tc and heat capacity Cc, and a coupled supporting mass by Ts and Cs. A conductance Gcs connects them. Separate conductances Gca and Gsa connect each node to ambient Ta. This structure allows the support temperature to evolve instead of treating it as an infinite fixed-temperature reservoir.
Each node must be sufficiently uniform internally over the observation interval. A small critical resistor or adhesive edge may need its own node if it differs from the measured ceramic surface. The heat capacities and conductances describe the installed assembly; they cannot be assigned from substrate conductivity alone. Use measured geometry, material information and paired transient observations to assess whether the reduced model represents the locations being protected.
Check the direction of heat flow immediately after shutdown
For zero electrical input at both nodes, the ceramic receives Gcs(Ts − Tc) from the support and loses Gca(Tc − Ta) to ambient. Dividing the net input by Cc gives its instantaneous rate of temperature change. It initially warms whenever incoming support heat exceeds its direct loss, even though no electrical source remains inside this model.
The supporting mass follows a second balance because it supplies the first node while also cooling to ambient. Keeping that second equation matters: a support with limited stored energy does not remain at its initial temperature indefinitely. A fixed hot-support approximation can overstate a later temperature if the support cools substantially during the same interval.
Cc dTc/dt = Gcs(Ts − Tc) − Gca(Tc − Ta); Cs dTs/dt = −Gcs(Ts − Tc) − Gsa(Ts − Ta)
- Cc and Cs are node heat capacities in J/K.
- Gcs, Gca and Gsa are thermal conductances in W/K.
- Tc, Ts and Ta use a consistent temperature scale; their differences are in kelvin.
Both modeled electrical inputs are zero, ambient is fixed, node properties and conductances are constant, and each node has a meaningful approximately uniform temperature. Ongoing external heating must be added explicitly.
Calculate an initial rise without adding energy to the assembly
Assume Tc initially equals 50°C, Ts equals 80°C and ambient equals 25°C. Let Cc = 2 J/K, Cs = 20 J/K, Gcs = 0.2 W/K, Gca = 0.05 W/K and Gsa = 0.1 W/K. These assumed values describe a numerical example, not a material grade, product limit or measured installation.
At shutdown, the support supplies six watts to the ceramic. Direct ceramic loss is 1.25 W, leaving 4.75 W to increase its stored energy. The initial ceramic slope is therefore 2.375 K/s. Meanwhile the entire two-node assembly loses 1.25 plus 5.5 W to ambient. Total stored energy decreases at 6.75 W while the ceramic temperature rises: redistribution and total cooling occur simultaneously.
Follow both temperatures to the delayed maximum
For the assumed constant coefficients, use temperatures above ambient. The ceramic solution is thetaC(t) = 45.009554 exp(−0.006557112 t) − 20.009554 exp(−0.133442888 t), with t in seconds and thetaC in kelvin. It satisfies the initial 25 K rise and the initial 2.375 K/s slope. Add 25°C to obtain the ceramic temperature.
Setting the derivative to zero gives a maximum at approximately 17.36 seconds, when the ceramic reaches 63.19°C. It is almost 13.2 K hotter than at power removal. This peak is not obtained by extending the initial straight-line slope: support cooling and the changing temperature difference reduce the incoming heat continuously.
| Time after shutdown | Ceramic temperature | Observation significance |
|---|---|---|
| 0 s | 50.00°C | Electrical input stops before the thermal peak |
| 5 s | 58.29°C | Substantial stored heat is still arriving |
| 10 s | 61.88°C | Rise continues with a reduced slope |
| 17.36 s | 63.19°C | Modeled delayed maximum |
| 60 s | 55.36°C | Cooling has started, but the circuit remains above its shutdown temperature |
| 120 s | 45.49°C | Later cooling does not describe the earlier peak |
Use conservation and limiting cases to check the calculation
With constant heat capacities, define stored energy above ambient as E = Cc(Tc − Ta) + Cs(Ts − Ta). Adding the two node equations cancels the internal exchange term. The result is dE/dt = −Gca(Tc − Ta) − Gsa(Ts − Ta). For both nodes above ambient, this derivative must be negative in the unpowered model. An unexplained positive total-energy trend points to a sign error, omitted source or changed boundary.
If the two initial temperatures are equal and above ambient, the ceramic initially cools rather than warming in this arrangement. If inter-node conductance is zero, support temperature cannot drive a ceramic rise. These limiting cases help detect an incorrect connection in a spreadsheet or numerical solver. They do not eliminate the need to validate the real heat paths.
Measure the hotter mass as well as the ceramic
Place synchronized temperature measurements at both modeled nodes and document attachment and response. A single delayed sensor can indicate a rise after power-off even when its actual target has already begun cooling. Compare its response with an independently characterized measurement, and retain the electrical record showing when delivered power actually reaches zero.
Record airflow, coolant state and nearby source temperatures through the shutdown interval. If a fan stops, the post-shutdown conductance to ambient can differ from the powered value. Fit or identify the relevant state separately rather than adjusting heat capacity to hide that change. Repeat from controlled initial temperatures, because two identical shutdown commands can produce different peaks after different preceding operating histories.
Choose the thermal change from the observed transfer path
Possible design responses include reducing the initial hot-mass exposure, preserving specified cooling after shutdown, redirecting the heat path or changing the coupling arrangement. These choices have different effects during normal operation. Reducing coupling may suppress soakback but also remove a useful operating heat-removal route. Evaluate both powered and unpowered states before treating weaker thermal contact as an improvement.
Compare the measured delayed peak with the independent temperature limits of the circuit, attached components, adhesives and surrounding equipment. A model of average ceramic temperature does not certify every local region or a protective function. The deliverable is a documented shutdown envelope, including initial states, source and cooling sequence, peak location and observation duration, that can be repeated after an assembly change.
Provide the complete shutdown thermal state
A soakback review needs the preceding operating history and the hardware that can continue transferring stored heat.
- Ceramic and neighboring hardware geometry, contact locations and the critical temperature observation points.
- Initial temperatures and the actual operating sequence that creates their difference.
- Synchronized ceramic, support and ambient temperatures through shutdown, plus delivered electrical power.
- Fan, coolant and neighboring-source states before and after the command, including any timing changes.
- Assembly-specific heat capacities, contact information, temperature limits and repeated-run variation.
The drawing-upload form loads as you reach this section.