
On this page
- What does the excess-noise index tell a designer?
- Define the band, reference and baseline
- Separate variance before normalizing voltage
- Recognize when comparison is unresolved
- Establish what the evidence supports
- Make the comparison reviewable
- Questions for the design review
- Prepare an engineering RFQ
- Related engineering resources
Prepared by Chipsimple Engineering Team, Engineering and technical content review
Published online November 16, 2026 · Reviewed November 16, 2026
What does the excess-noise index tell a designer?
A printed resistor under DC loading can exhibit additional current-noise voltage beyond its thermal noise. The design question is how much of the observed voltage belongs to that excess component, rather than to the thermal baseline or measurement instrument. Excess-noise index expresses the separated voltage relative to the applied DC voltage over one frequency decade. It supports comparison only when the measurement conditions and normalization are explicit.
Two total RMS readings cannot establish that comparison by themselves. Their integration bands may differ, their baselines may contribute different fractions, or their thermal states may be unequal. A useful review therefore starts with the input-referred measurement chain and ends with either a defensible excess-noise index or an unresolved excess component. Neither a photograph nor the existence of a measurement method establishes a sample's noise performance.
Define the band, reference and baseline
Specify the lower and upper integration frequencies, f1 and f2, with f2/f1 = 10. Report both endpoints: saying only “per decade” leaves the measured frequency region unclear. Express measured and baseline voltages at the same input reference, using the applicable chain gain and filtering. Keep the integration band identical when separating the excess contribution, and use the same stated decade when comparing samples.
The ideal resistor thermal voltage-noise density is sqrt(4kTR) V/sqrt(Hz), with temperature T in kelvin. Its integrated RMS voltage is sqrt(4kTRB), where B is the effective noise bandwidth. A density is not an RMS voltage, and a filter's equivalent noise bandwidth need not match its nominal display bandwidth. This thermal model excludes excess noise and instrument contributions, so it does not by itself describe the complete measurement baseline.
Baseline subtraction additionally assumes that the baseline and excess contributions are uncorrelated and that the baseline remains representative under bias. Loading, gain, filters, resistance and thermal state must support that assumption. A zero-bias spectrum is not automatically suitable: applying DC bias can change temperature or circuit behavior, invalidating the comparison even when the frequency endpoints remain unchanged.
Separate variance before normalizing voltage
First obtain matched-band, input-referred RMS values for the biased measurement and the independently justified baseline. For uncorrelated contributions, the model is Vmeas,rms² = Vex,rms² + Vbase,rms². Recover the excess voltage as Vex,rms = sqrt(Vmeas,rms² − Vbase,rms²), provided the difference is positive and resolved within uncertainty. Subtracting RMS amplitudes directly does not implement this variance model.
Then use NI = 20 log10[(Vex,rms / |VDC|) / (10^-6)] dB. Both voltages are expressed in volts, |VDC| must exceed zero, and Vex,rms must be integrated over the stated decade. The reference is explicit: 0 dB represents 1 microvolt per volt per decade. The logarithm acts on a dimensionless ratio, rather than an unspecified voltage.
As independent hypothetical arithmetic, measured and baseline values of 5 and 3 microvolts give sqrt(25 − 9) = 4 microvolts of excess voltage, rather than 2 microvolts. At a 10-volt DC bias over one defined decade, this is 0.4 microvolt per volt and NI approximately −7.96 dB. These figures illustrate calculation only; they describe no photographed sample, company result or available measurement service.
| Evidence condition | Engineering action | Reportable outcome |
|---|---|---|
| Same decade, justified baseline and resolved positive variance difference | Subtract variances, take the square root and normalize to |VDC| | NI with stated bias, decade and measurement conditions |
| Nonpositive or uncertainty-limited variance difference | Retain the separation limit | Unresolved excess component; no numerical NI |
| Different integration bands without a verified spectral model | Obtain matched-band measurements | Comparison remains unsupported |
| Bias changes thermal state or circuit behavior | Re-establish a representative baseline | Existing subtraction requires reassessment |
Recognize when comparison is unresolved
When measured and baseline variances are close, their difference may not resolve an excess component within uncertainty. A positive arithmetic difference alone is insufficient evidence for a numerical index. If the difference is nonpositive or unresolved, report an unresolved excess component. Calling it zero noise would overstate what the measurement established, while calculating an index would hide the limitation.
Frequency normalization also needs evidence. For a separately verified spectrum S_ex(f) = K/f in V²/Hz, integration gives Vex,rms² = K ln(f2/f1), so equal frequency ratios yield equal model variance. This result does not authorize conversion of an arbitrary measured spectrum into a decade value. Likewise, a white-noise sqrt(B) scaling rule cannot be applied indiscriminately to excess noise.
Retain visible records of line-interference peaks, source ripple, contact events and filtering decisions. These features matter when interpreting the integrated reading and deciding whether two measurements are comparable. Filtering choices should remain part of the reported conditions so that a reviewer can understand what contributed to, or was excluded from, the final band integral.
Establish what the evidence supports
Before accepting an index, review the chain's input reference, gain, filters and integration endpoints alongside the baseline justification. Confirm that resistance, loading and thermal conditions remain representative during the biased measurement. Where a thermal calculation contributes to that justification, retain its temperature and effective noise bandwidth. These checks connect the mathematical separation to the actual measurement conditions.
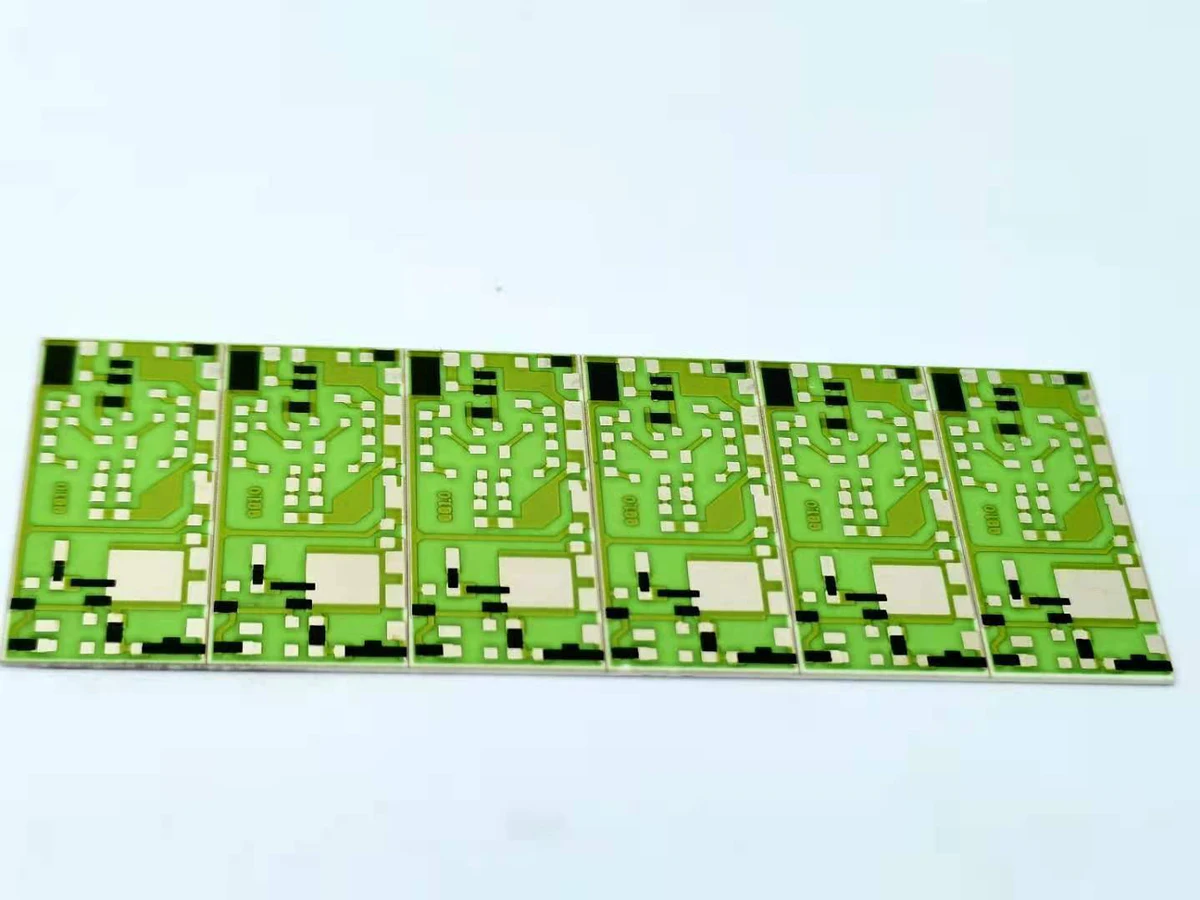
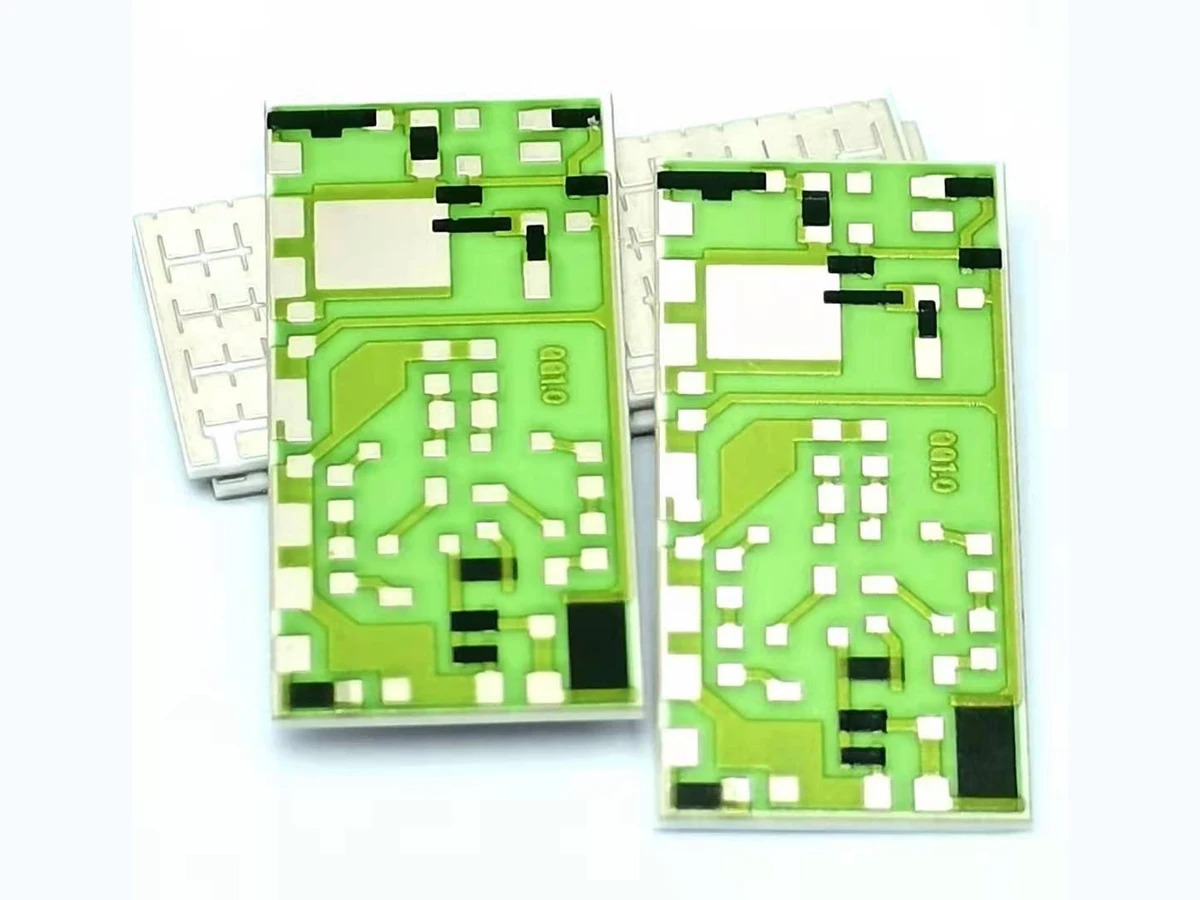
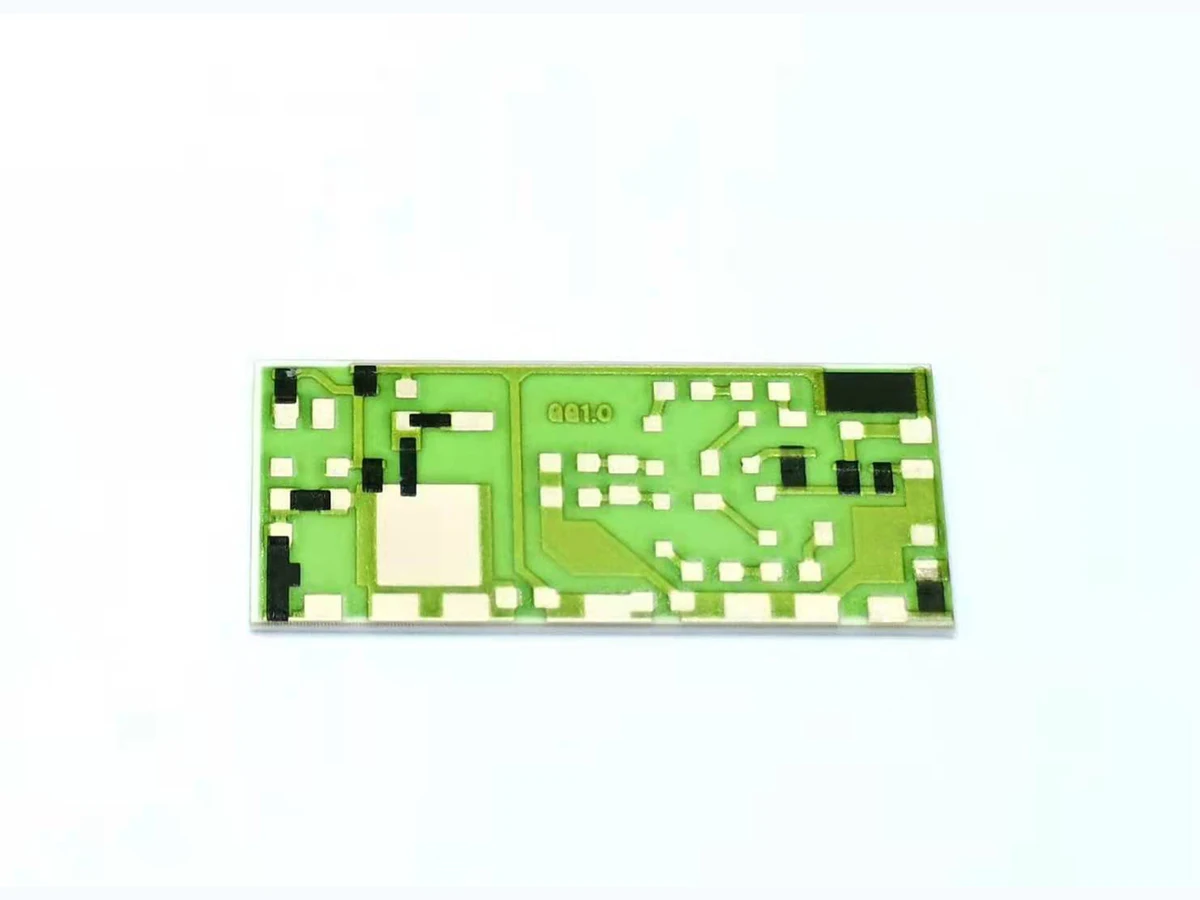
Keep physical identification separate from electrical evidence. The three original sample photographs identify sample layout, terminal observation and single-sample orientation; they show neither a noise-test setup nor a result. They cannot establish a noise floor, measured index, lifetime, certification or company test capability. Supplier technology rankings and typical values also cannot be transferred to those samples.
Make the comparison reviewable
A useful design discussion needs enough information to reconstruct the band integral, baseline subtraction and bias normalization. Provide the sample identification, resistance and thermal conditions together with the measurement-chain definition. State the applied DC voltage and both decade endpoints, so another engineer can check the normalization without inferring missing conditions.
The review outcome should distinguish a resolved index from an unresolved component or an unsupported comparison. If bands differ, obtain matched-band evidence before comparing indices. If the baseline is unrepresentative or uncertainty dominates the subtraction, retain that limitation in the result. This gives the next design discussion a concrete information requirement without assigning an unsupported property to the resistor.
Questions for the design review
Can I subtract 3 microvolts of baseline from 5 microvolts measured?
For justified uncorrelated, matched-band contributions, subtract variances: sqrt(5² − 3²) = 4 microvolts. This hypothetical calculation is not a sample result.
Can equal-width bands in hertz be compared as equal decades?
A decade requires f2/f1 = 10, not a fixed width in hertz. Equal frequency ratios give equal excess variance only under the separately verified K/f model.
Does a negative NI mean the resistor has no excess noise?
No. A negative NI means the resolved normalized excess voltage is below the reference of 1 microvolt per volt per decade. An unresolved component should receive no numerical NI.
Prepare an engineering RFQ
- Sample identification, layout and terminal identification
- Resistance and thermal conditions for biased and baseline measurements
- Applied DC voltage magnitude
- Lower and upper frequencies defining the measurement decade
- Input reference, chain gain, filters and effective noise bandwidth where applicable
- Matched-band measured and baseline RMS values, with baseline justification
- Uncertainty assessment, interference observations and filtering decisions